Dashboard Examples
See how teams use Knowi for IoT
Monitor operations, reduce downtime, and make faster decisions with real-time IoT dashboards.
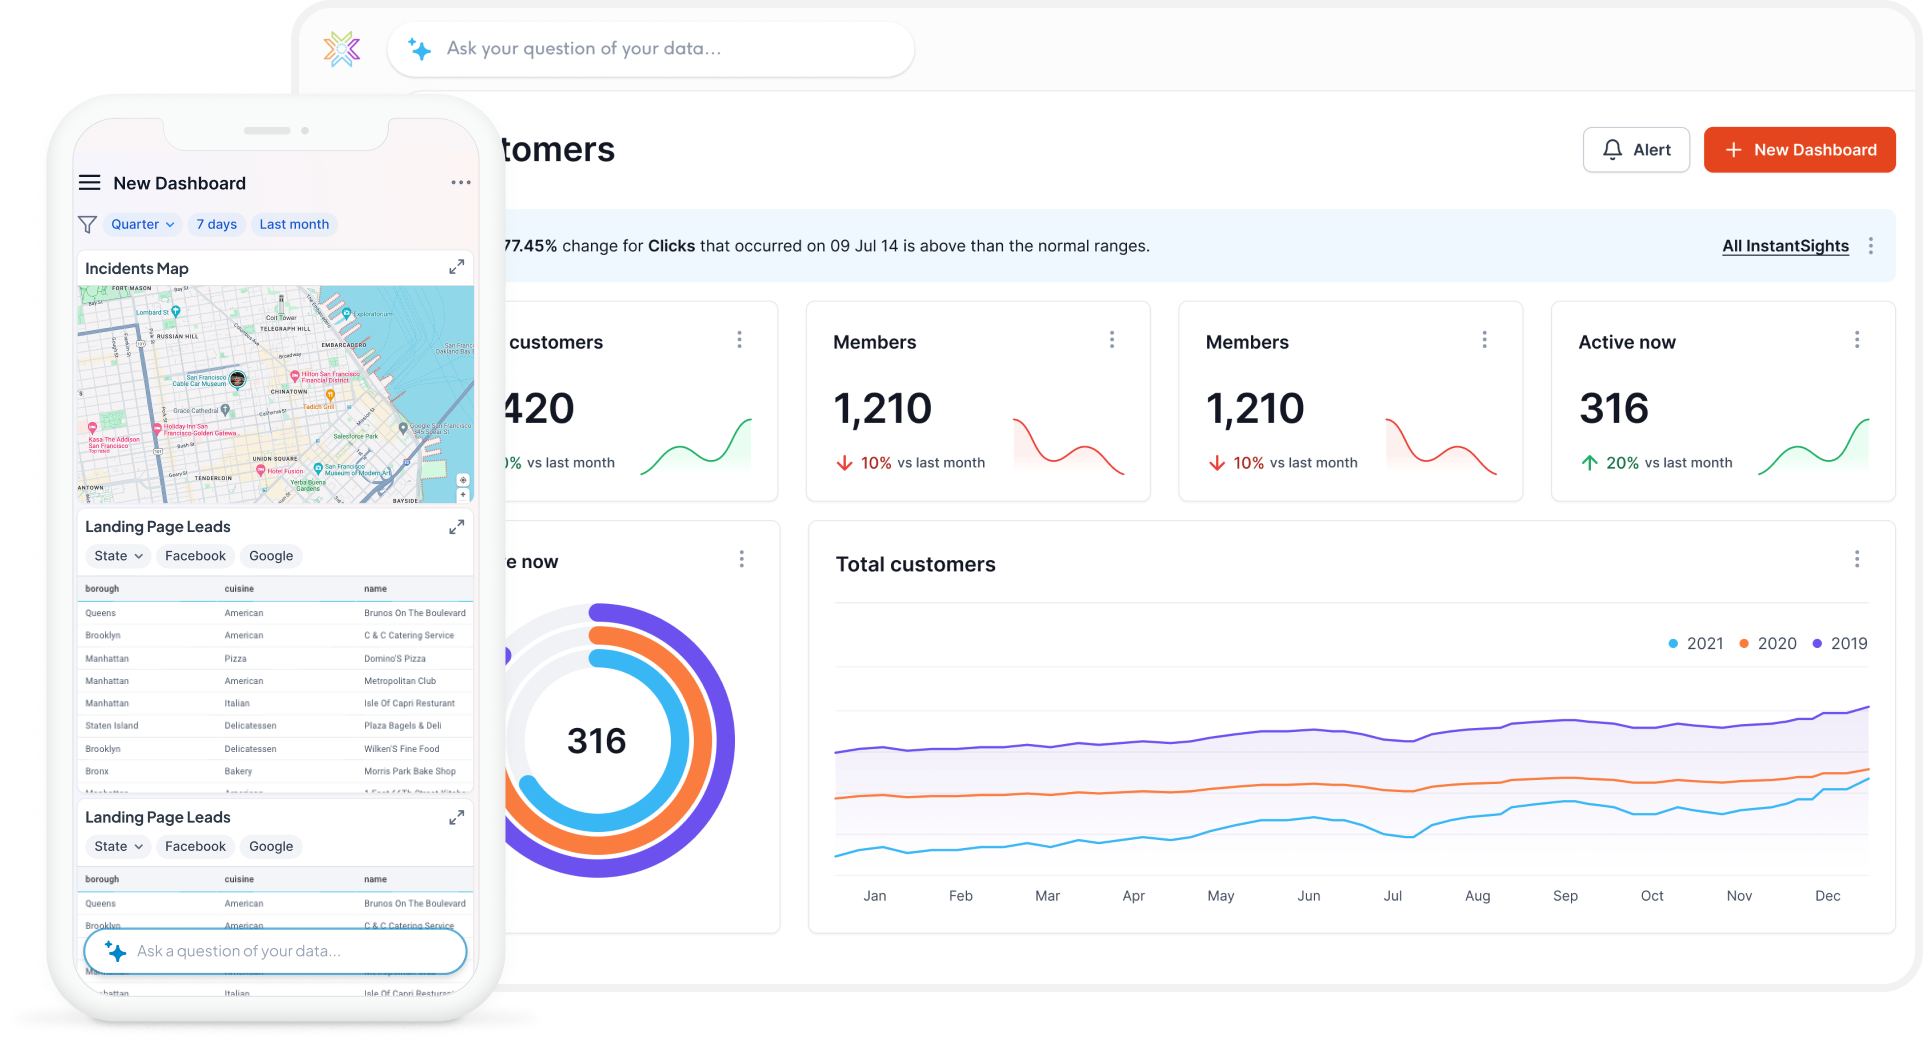
IoT Analytics Dashboard
Give operators a single pane of glass to monitor device capacity, throughput, and health in real time. Built-in anomaly detection flags irregular patterns — temperature spikes, traffic surges — so your team acts before issues become incidents.
See the dashboard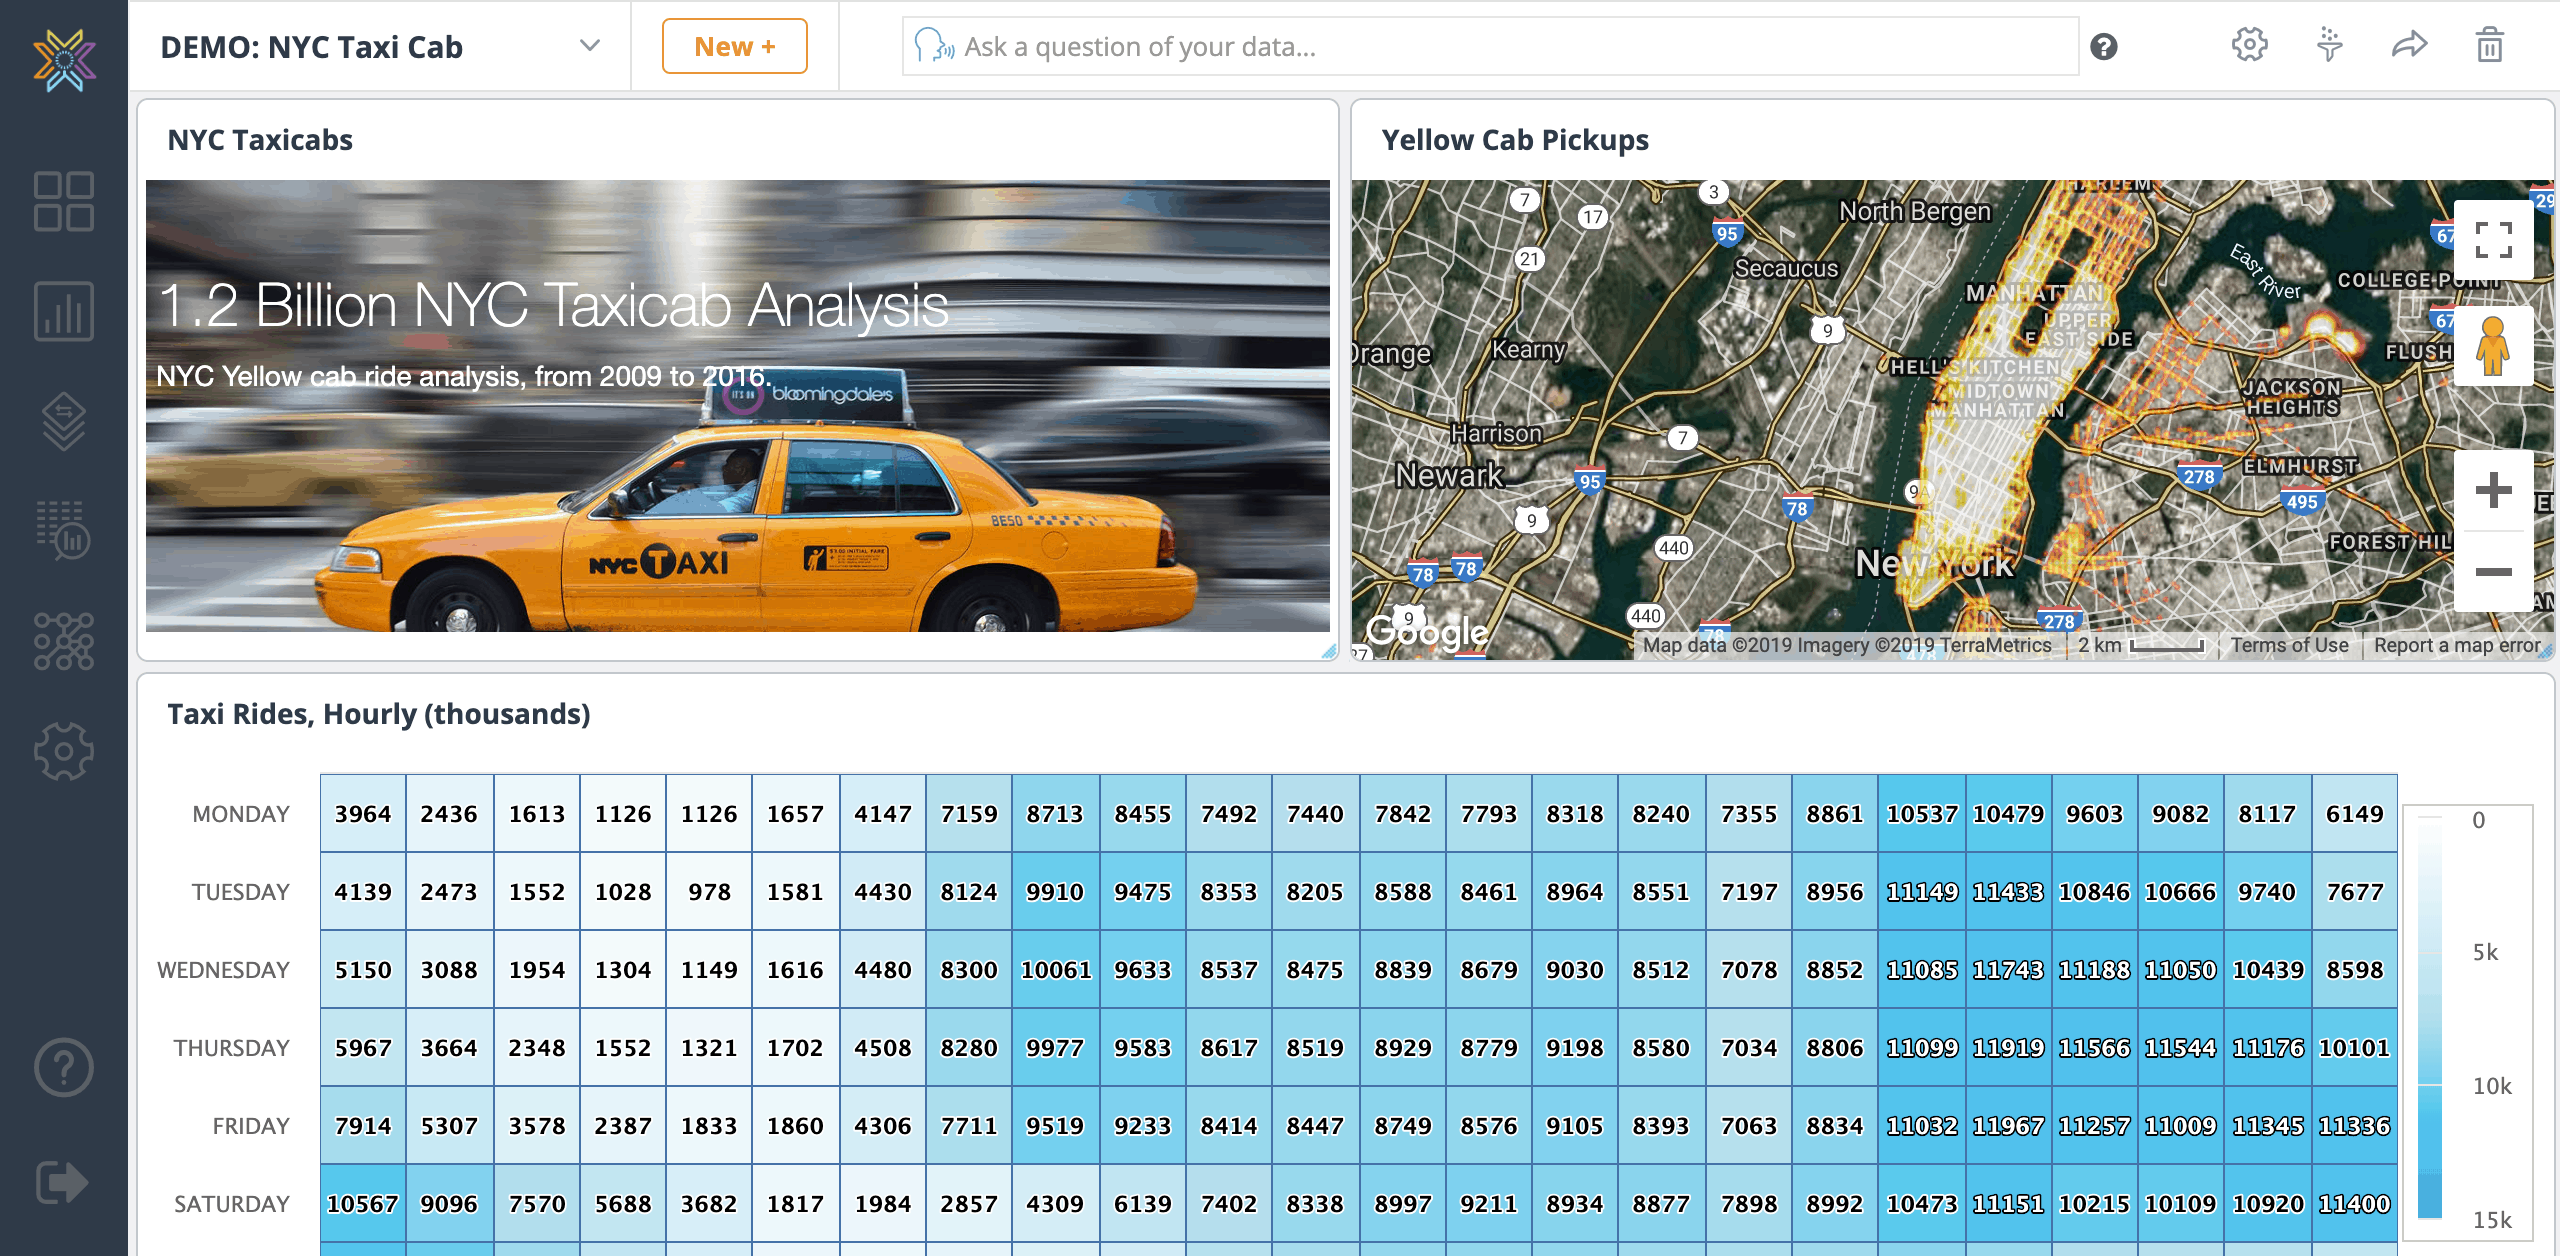
Fleet Management Dashboard
Track vehicle status, fuel consumption, and maintenance schedules across your fleet. Combine GPS telemetry with maintenance records to predict when servicing is needed — reducing unplanned downtime and extending asset life.
See the dashboard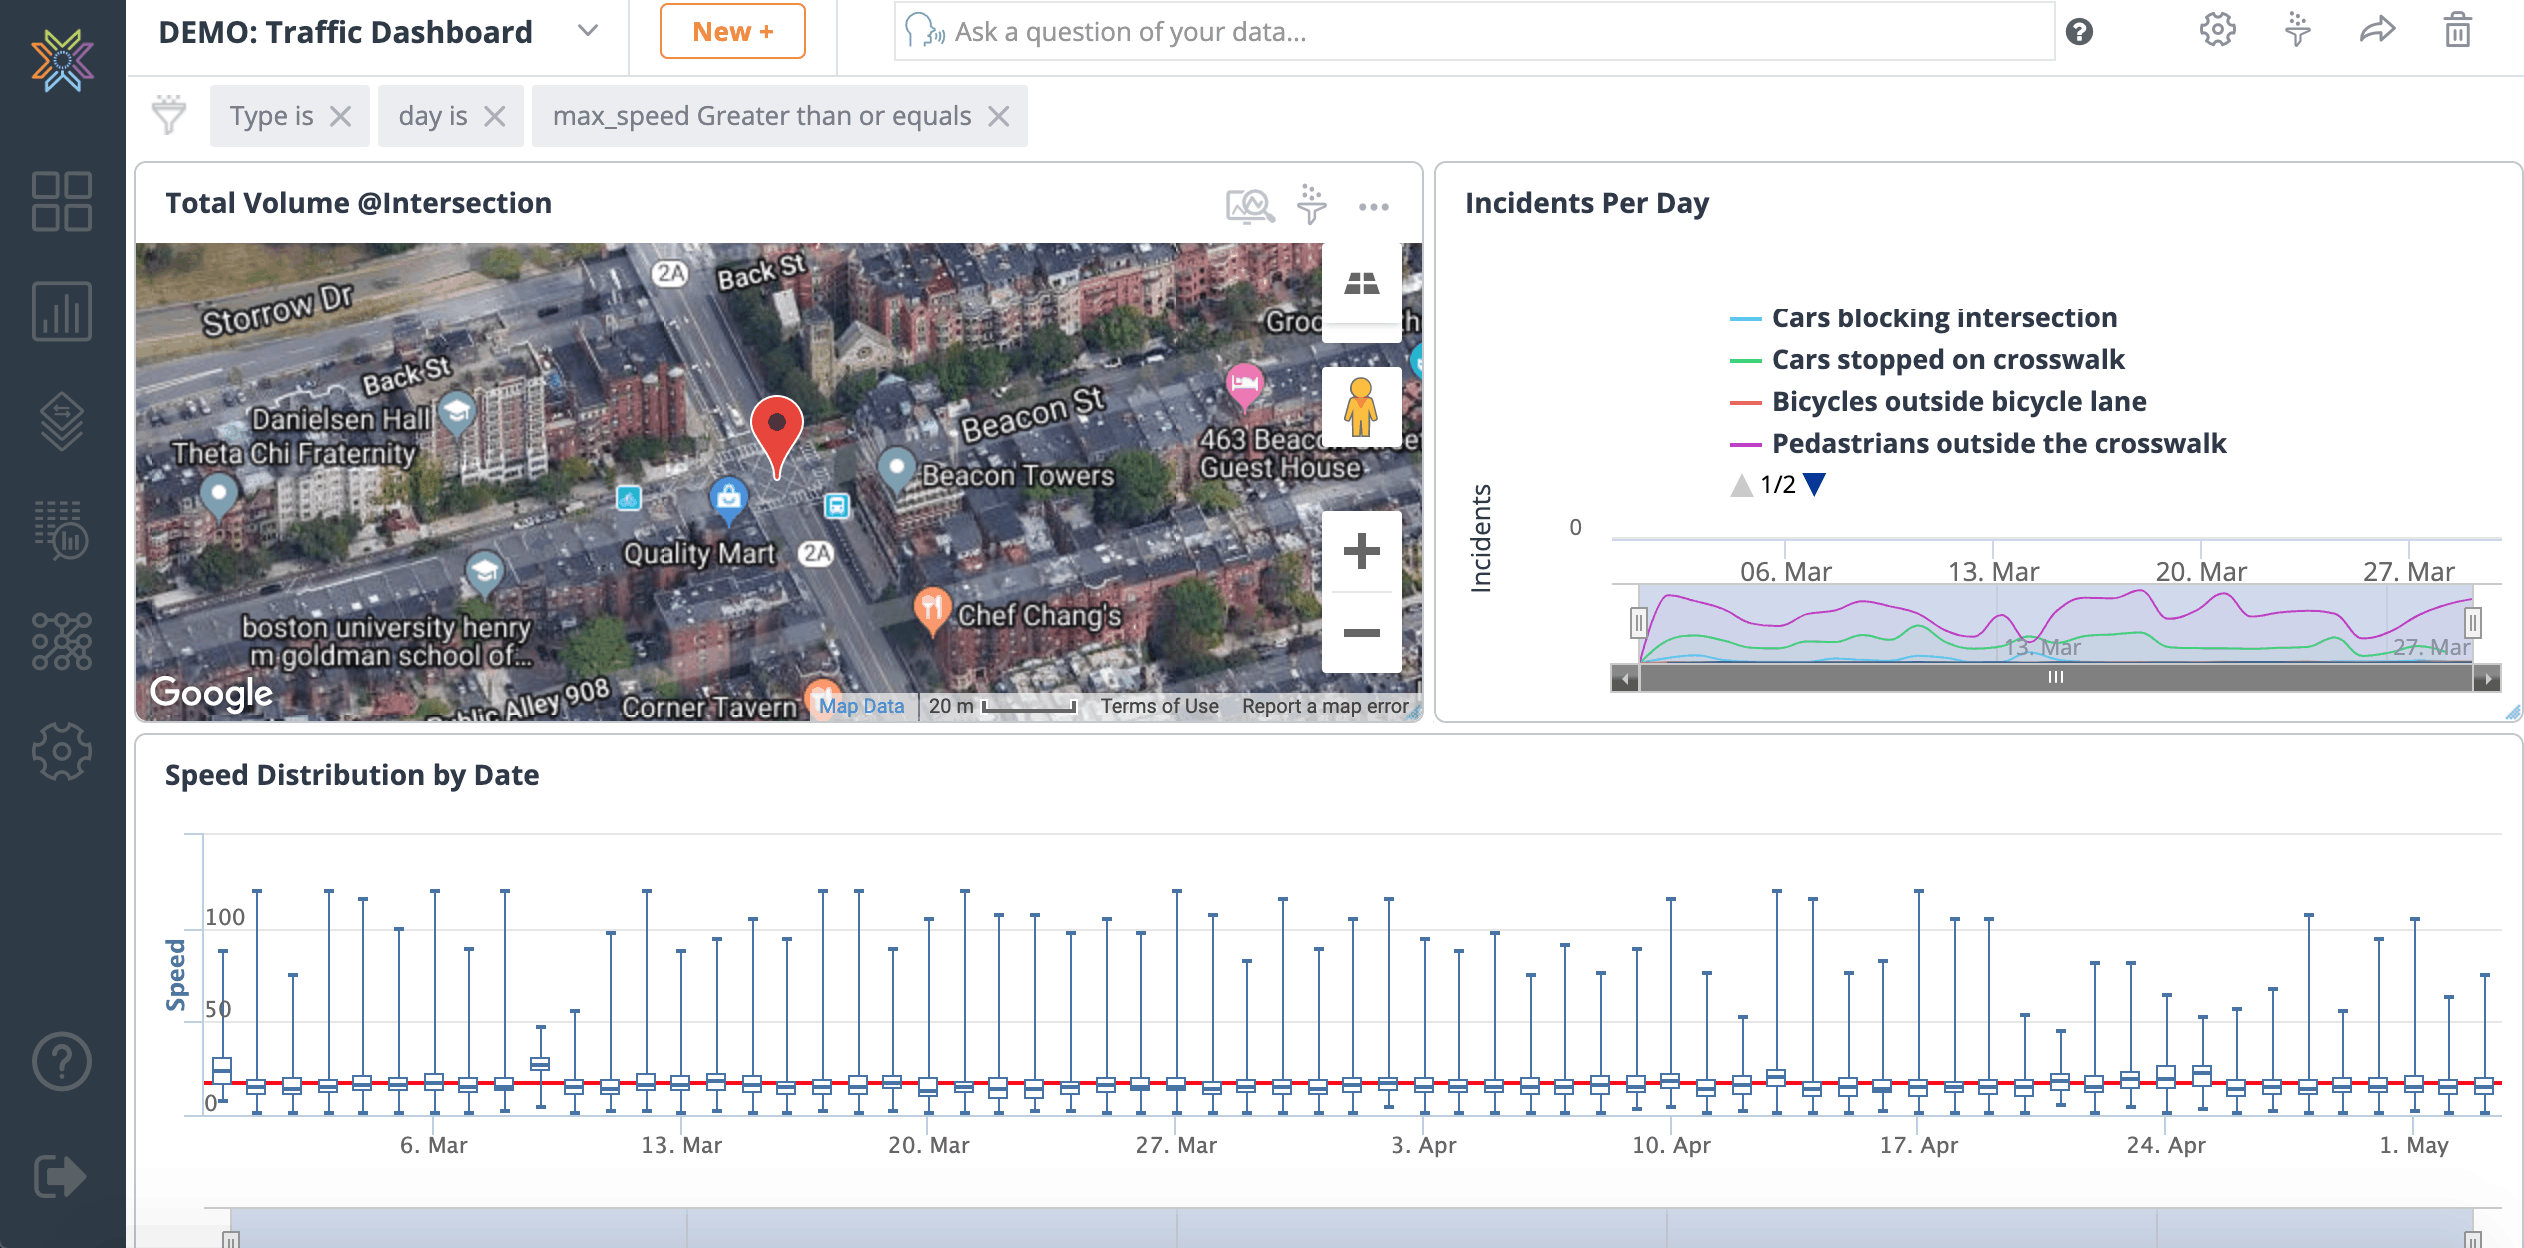
Smart Cities Dashboard
Combine data from traffic sensors, cameras, and bike-share systems into one view. Optimize signal timing, identify high-risk intersections, and measure the impact of infrastructure changes — all in real time.
See the dashboard