
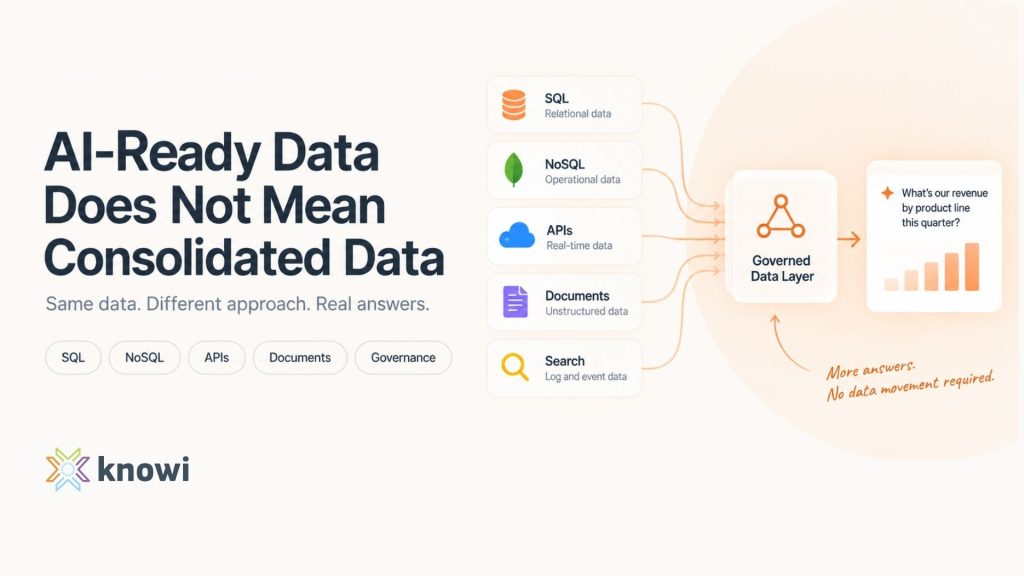
AI-Ready Data Does Not Mean Consolidated Data
AI readiness is a semantics and governance problem, not a storage location. What enterprise teams need across SQL, NoSQL, APIs and documents.
Introducing Knowi Apps: The Part After the Dashboard
BI tools help you go from data to insights, what is happening in your business. Then you have to decide what actions you need to
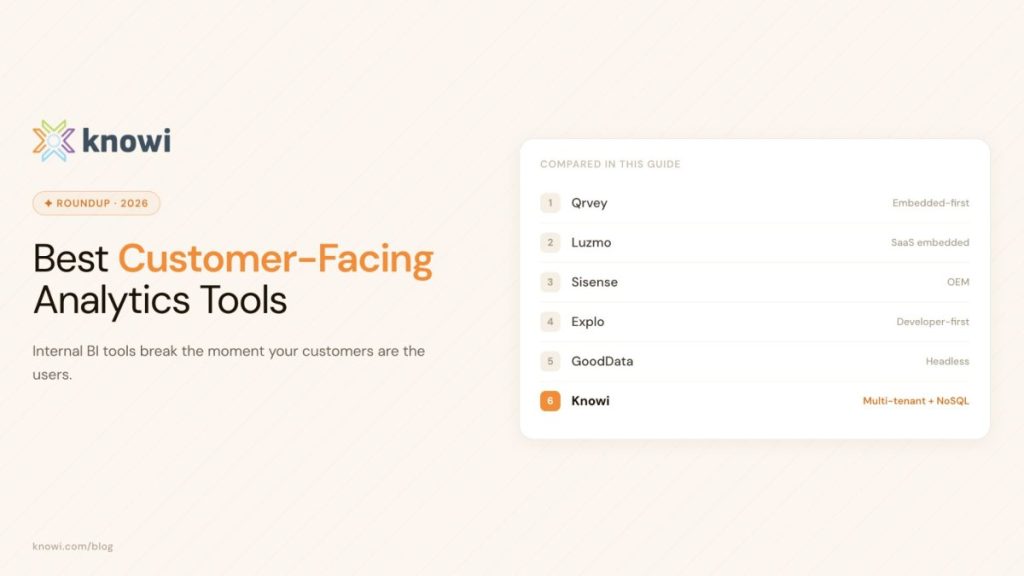
Best Customer-Facing Analytics Tools 2026
The best customer-facing analytics tools in 2026 are Looker, ThoughtSpot, Sisense, GoodData, Qrvey, Luzmo, Explo, Cube, and Knowi. The right pick…
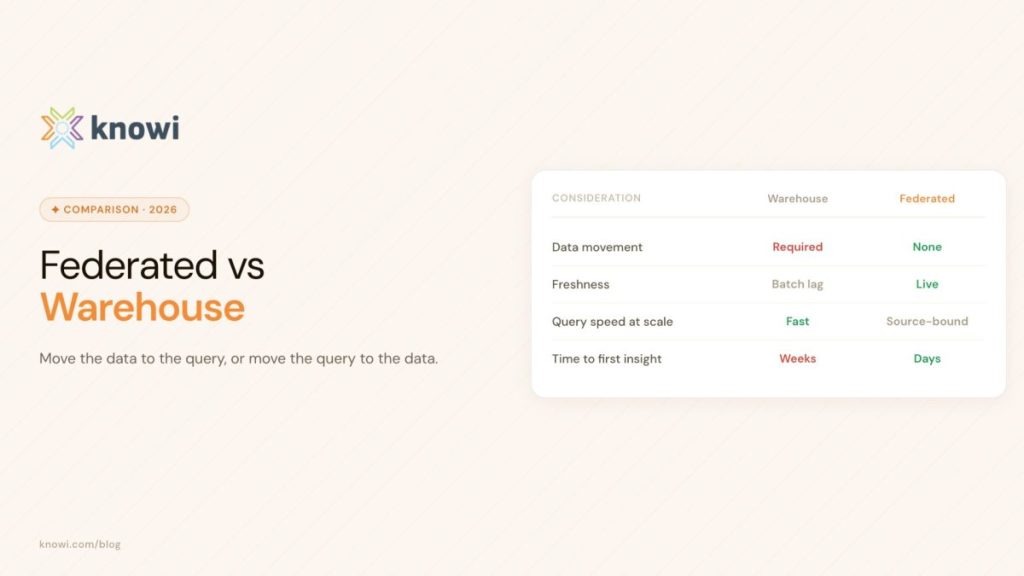
Federated Analytics vs Data Warehouse
Whether to federate queries across live sources or centralize data in a warehouse first comes down to latency tolerance, join size, and compliance…
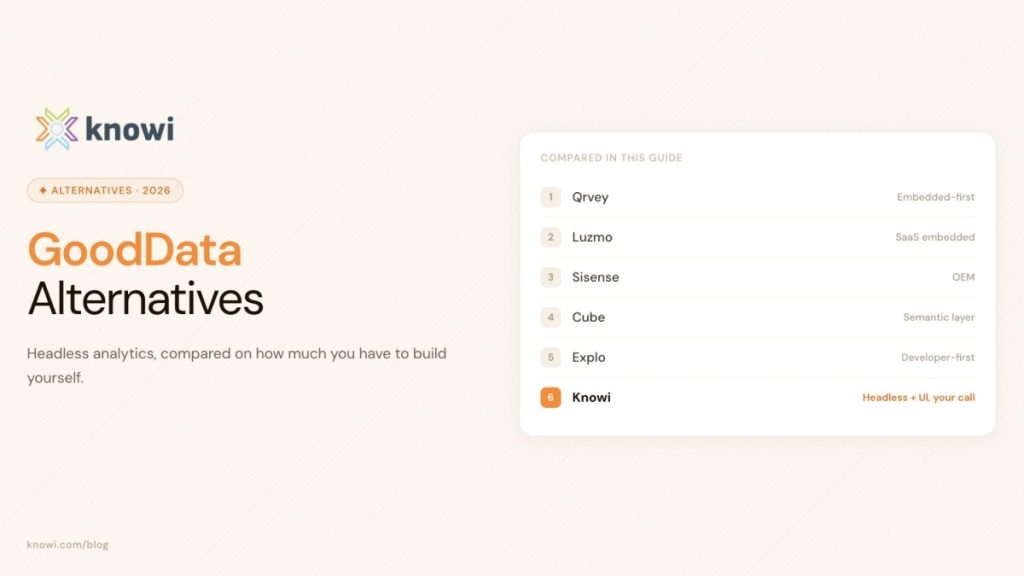
GoodData alternatives
GoodData customers are evaluating alternatives over MAQL’s learning curve, workspace-per-tenant pricing, quote-only procurement, and, for a narrower…
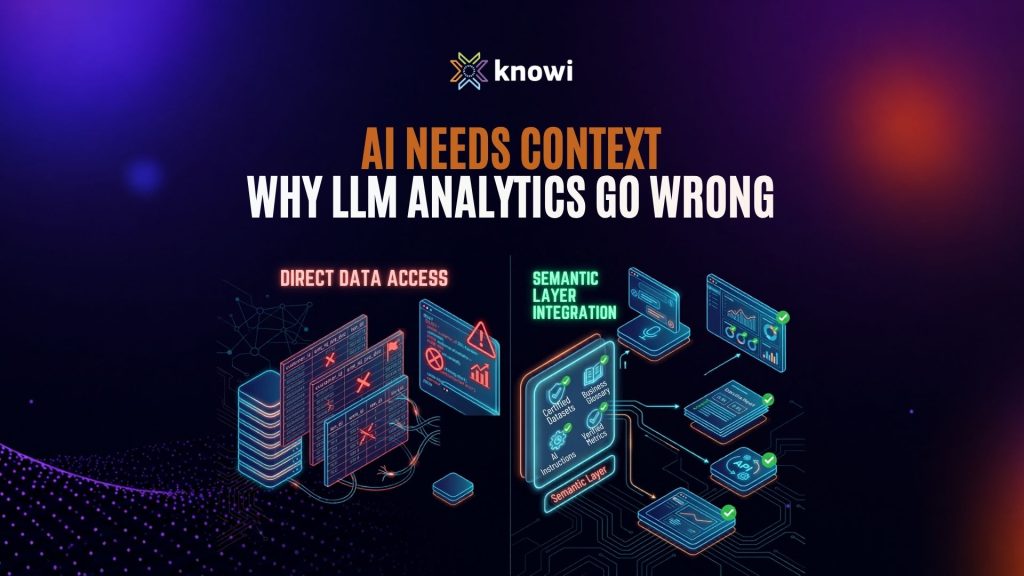
Semantic Layer for AI: Why LLM Analytics Fail Without One
LLMs write valid SQL that returns wrong numbers. The benchmark evidence, how AI BI tools consume semantic context, and what actually fixes accuracy.
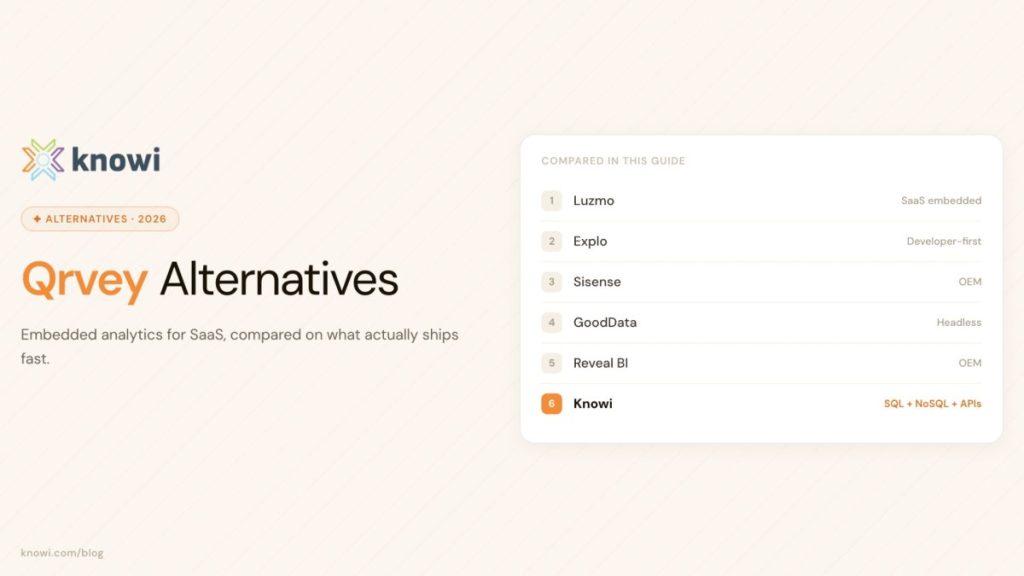
Qrvey alternatives
Qrvey alternatives that reduce or remove the Kubernetes operational burden include Embeddable and Luzmo (fully managed SaaS), Sisense, GoodData, and…
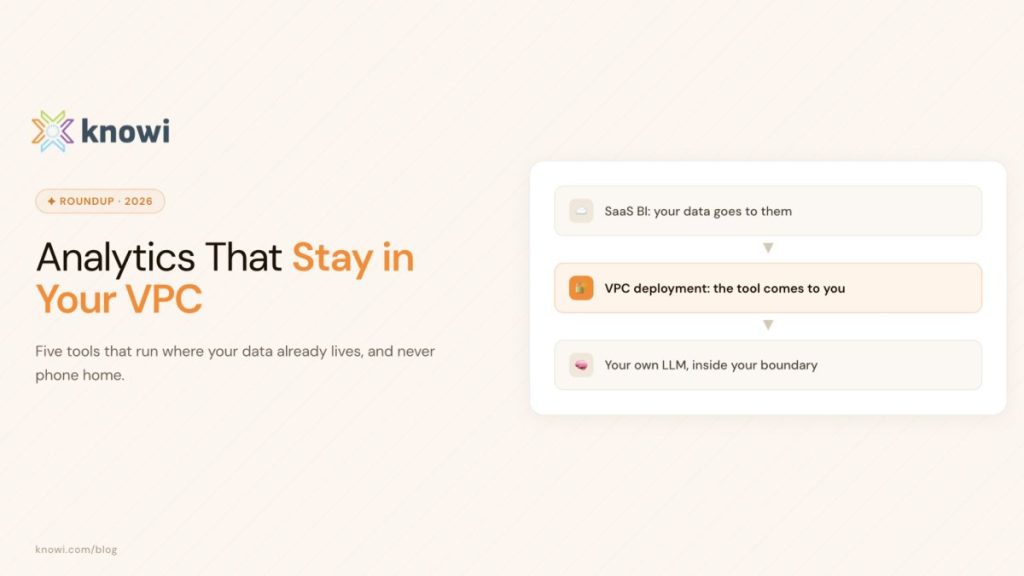
Secure analytics for sensitive PII data
Secure PII analytics under GDPR, CCPA/CPRA, and PCI DSS comes down to four questions: which regulations the exact service covers, whether a signed…
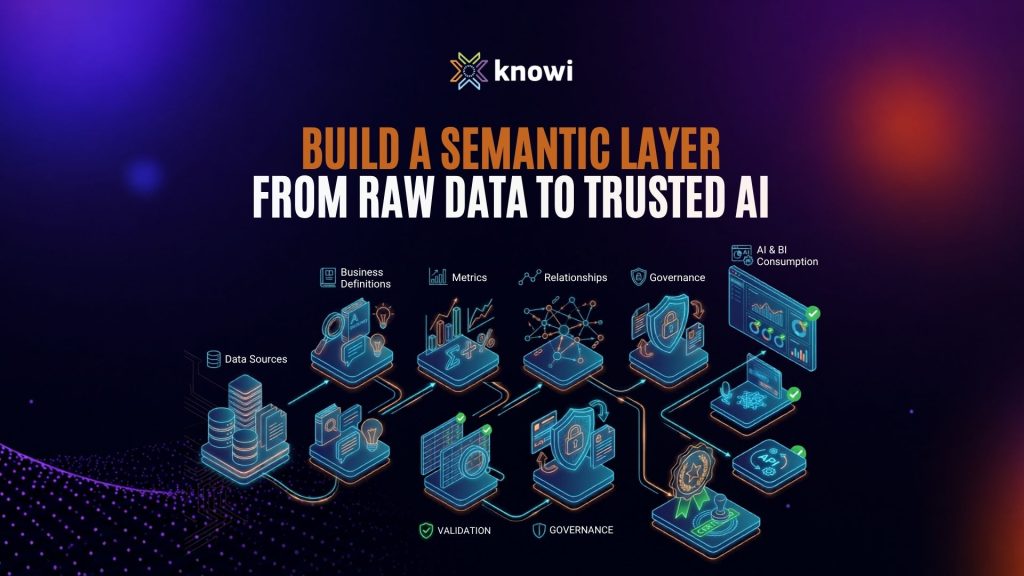
How to Build a Semantic Layer: Steps and Realistic Timelines
The 8-step process to build a semantic layer, realistic timelines for dbt, Cube, LookML, Power BI, and Snowflake, and the shortcuts that actually work.